Enrollment Facts Fall 2007 - 2011
| College | Fall 2007 | Fall 2008 | Fall 2009 | Fall 2010 | Fall 2011 |
|---|---|---|---|---|---|
| Liberal Arts & Behavioral Sciences | 2004 | 1830 | 1839 | 1850 | 1684 |
| Business | 1631 | 1545 | 1609 | 1459 | 1499 |
| Education | 1036 | 1049 | 1166 | 1236 | 1197 |
| Pharmacy & Health Science | 1738 | 1610 | 1516 | 1540 | 1518 |
| Science & Technology | 1381 | 1349 | 1447 | 1491 | 1559 |
| Law School | 580 | 550 | 542 | 571 | 574 |
| Public Affairs | 668 | 654 | 718 | 828 | 1067 |
| Communications | 502 | 515 | 557 | 582 | 632 |
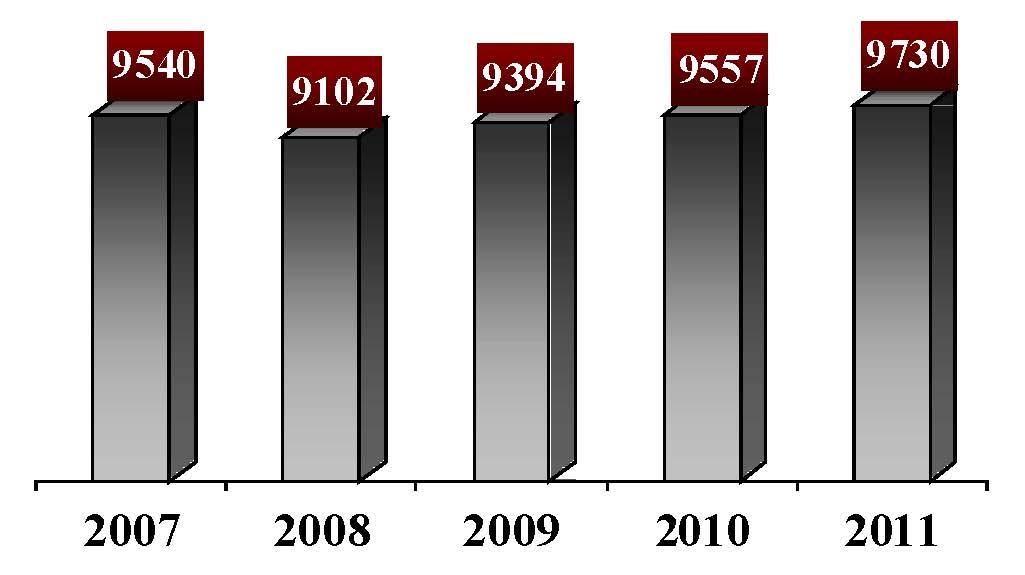
| Total | 9540 | 9102 | 9394 | 9557 | 9730 |
| Ethnicity | Fall 2007 | Fall 2008 | Fall 2009 | Fall 2010 | Fall 2011 |
|---|---|---|---|---|---|
| White, Non-Hispanic | 267 | 215 | 219 | 261 | 274 |
| Black, Non-Hispanic | 8017 | 7724 | 7857 | 8016 | 8039 |
| Hispanic | 451 | 429 | 458 | 500 | 543 |
| Asian or Pacific Islander | 438 | 412 | 420 | 467 | 465 |
| American Indian/ Alaskan Native | 16 | 11 | 12 | 20 | 19 |
| International | 323 | 294 | 302 | 289 | 326 |
| Unspecified | 28 | 17 | 126 | 4 | 64 |
| Total | 9540 | 9102 | 9394 | 9557 | 9730 |
| Residency Status | Fall 2007 | Fall 2008 | Fall 2009 | Fall 2010 | Fall 2011 |
|---|---|---|---|---|---|
| Instate | 8046 | 7634 | 7955 | 8157 | 8219 |
| Out of State | 1234 | 1220 | 1172 | 1118 | 1180 |
| Foreign | 260 | 247 | 267 | 280 | 330 |
| Unspecified | - | 1 | - | 2 | 1 |
| Total | 9540 | 9102 | 9394 | 9557 | 9730 |
| Gender | Fall 2007 | Fall 2008 | Fall 2009 | Fall 2010 | Fall 2011 |
|---|---|---|---|---|---|
| Male | 3886 | 3735 | 3947 | 4038 | 4054 |
| Female | 5654 | 5367 | 5447 | 5519 | 5676 |
| Total | 9540 | 9102 | 9394 | 9557 | 9730 |
| Age Range | Fall 2007 | Fall 2008 | Fall 2009 | Fall 2010 | Fall 2011 |
|---|---|---|---|---|---|
| 17 and Under | 23 | 25 | 27 | 37 | 19 |
| 18- 19 | 1722 | 1779 | 1677 | 1518 | 1540 |
| 20- 21 | 1869 | 1671 | 1808 | 1705 | 1545 |
| 22- 24 | 2382 | 2156 | 2175 | 2131 | 2193 |
| 25- 29 | 1740 | 1730 | 1858 | 2046 | 2102 |
| 30- 34 | 706 | 675 | 735 | 840 | 876 |
| 35- 39 | 445 | 427 | 436 | 465 | 511 |
| 40- 49 | 450 | 425 | 448 | 539 | 626 |
| 50- 64 | 199 | 210 | 224 | 264 | 307 |
| 65 or Older | 4 | 4 | 6 | 12 | 11 |
| Total | 9540 | 9102 | 9394 | 9557 | 9730 |
Classification by Enrollment Status
| Fall 2007 | Fall 2008 | Fall 2009 | Fall 2010 | Fall 2011 | ||||||
|---|---|---|---|---|---|---|---|---|---|---|
|
Full-time |
Part-time |
Full-time |
Part-time |
Full-time |
Part-time |
Full-time |
Part-time |
Full-time |
Part-time |
|
|
Freshmen |
1106 |
217 |
1140 |
147 |
1233 |
207 |
1063 |
159 |
938 |
159 |
|
Sophomore |
539 |
106 |
477 |
91 |
502 |
82 |
593 |
91 |
539 |
90 |
|
Junior |
423 |
115 |
398 |
123 |
386 |
88 |
428 |
80 |
501 |
89 |
|
Senior |
441 |
177 |
464 |
143 |
480 |
157 |
459 |
142 |
491 |
154 |
|
Post Bachelorette |
10 |
11 |
10 |
8 |
15 |
8 |
26 |
15 |
18 |
19 |
|
Masters |
106 |
107 |
90 |
124 |
153 |
123 |
240 |
199 |
276 |
225 |
|
Doctoral |
14 |
22 |
27 |
22 |
28 |
34 |
33 |
37 |
39 |
37 |
|
Professional |
395 |
97 |
379 |
92 |
388 |
63 |
388 |
85 |
382 |
97 |
|
Total |
3034 |
852 |
2985 |
750 |
3185 |
762 |
3230 |
808 |
3184 |
870 |
| Fall 2007 | Fall 2008 | Fall 2009 | Fall 2010 | Fall 2011 | ||||||
|---|---|---|---|---|---|---|---|---|---|---|
|
Full-time |
Part-time |
Full-time |
Part-time |
Full-time |
Part-time |
Full-time |
Part-time |
Full-time |
Part-time |
|
|
Freshmen |
1348 |
246 |
1385 |
202 |
1361 |
233 |
1281 |
150 |
1139 |
208 |
|
Sophomore |
708 |
176 |
630 |
178 |
724 |
159 |
730 |
161 |
659 |
174 |
|
Junior |
697 |
206 |
537 |
186 |
555 |
148 |
590 |
133 |
653 |
166 |
|
Senior |
798 |
269 |
765 |
265 |
666 |
277 |
684 |
220 |
659 |
262 |
|
Post Bachelorette |
19 |
10 |
15 |
13 |
14 |
16 |
31 |
23 |
45 |
38 |
|
Masters |
225 |
284 |
213 |
308 |
290 |
334 |
352 |
423 |
528 |
408 |
|
Doctoral |
23 |
50 |
48 |
54 |
55 |
57 |
84 |
75 |
97 |
74 |
|
Professional |
438 |
157 |
429 |
139 |
476 |
82 |
481 |
101 |
435 |
131 |
|
Total |
4256 |
1398 |
4022 |
1345 |
4141 |
1306 |
4233 |
1286 |
4215 |
1461 |